It has been a tough year for managed futures. So bad, in fact, that the rolling 12-month Sharpe Ratio for the BarclayHedge CTA index hit a historic low. Some investors may be considering abandoning their managed futures position in favor of something performing better, but a closer look at the chart may give you ample reason to reverse that opinion. By viewing the long-term performance, you see the rolling 12-month Sharpe ratio fluctuated over time. It swung back and forth between a peak of +3 and a low of -2, with negative periods followed by positive periods and vice versa. Managed futures are a cyclical alternative investment strategy with some regularity in its swings between periods of strong and weak performance.
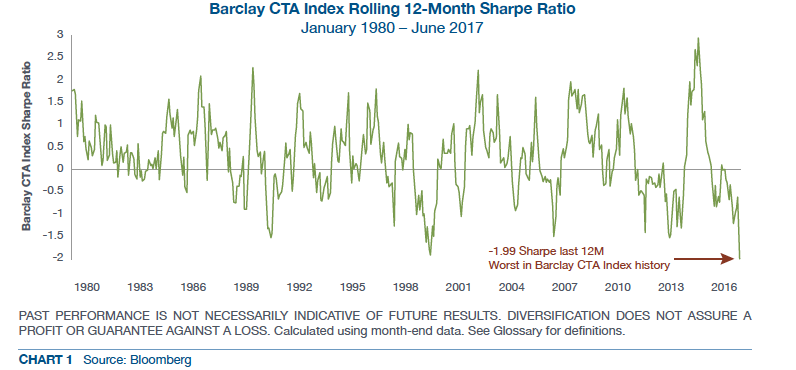
If we examine the worst periods since 1980 we see that there were 23 times when the CTA Index had a Sharpe lower than -1. On 22 of the 23 occasions, the next 12 months saw a positive Sharpe ratio. This index is clearly exhibiting empirical evidence of mean reversion bias. Simply put, worst periods of performance tended to be followed by better periods and vice versa. So, it follows that a period of poor performance improves the odds for positive performance over the following 12 months.
Clearly, there are more advantageous times than other for initiating a managed futures program or adding to an established one. However, taking advantage of this requires an ability to market time. Part of the problem in market timing is that investors generally find it difficult to invest in an asset class after a drawdown. Sentiment and negative news coverage often leads to the crowd withdrawing capital rather than adding. Conversely, the crowd will often add to an asset class after it is already performing well. This is called “chasing performance” and historically has negatively impacted managed futures returns.
Manage futures uniquely thrives during periods of rapidly expanding volatility. Therefore, a large portion of total returns has been generated in relatively brief periods. Fortunately, this has often coincided with periods of difficult performance for traditional investments, such as the tech bubble collapse and the 2008 financial crisis.
With current stock volatility hovering right above all-time record lows and a new low in the managed futures Sharpe performance, the confluence of these two key indicators may be signaling a high probability of a reversion to the mean in the managed futures index. Those under-allocated to managed futures may consider the current market as offering a great opportunity.
–Tom Reavis
The content of this article is based upon the research and opinions of Tom Reavis.